Your Biological Age Test Might Be Lying to You
The $500 epigenetic clock, the free bloodwork alternative, and what actually predicts how fast you're aging.
I took five biological age tests in a year. My age ranged from 15 years younger to 3 years older than my chronological age.
If that sounds like a bunch of broken tests, you're not wrong. But it's also not the full story.
The biological age testing market has exploded into a $500 million industry. Everyone from biohackers to retirees is spitting into tubes and pricking fingers to find out their "real age." But most people have no idea what their test is actually measuring, whether the number means anything, or what to do with it.
Here's what I learned after running TruDiagnostic, GlycanAge, Generation Lab, PhenoAge, and DunedinPACE on myself, and digging into the research that most bio-age companies don't want you to read.
This is a very long issue, but I think it’s a gold mine for anyone with questions about biological age!
IN THIS ISSUE:
📊 Your bio-age test gave you a number. Here's what it actually means (and doesn't).
🧬 Why 14 epigenetic clocks can't agree on your age, and what that tells us about the science.
💉 The $200 bloodwork that predicts cardiovascular outcomes as well as a $500 epigenetic test.
🔬 My testing stack: what I run, what I skip, and what changed my clinical plan.
What is "biological age" anyway?
Your chronological age is how many times you've orbited the sun. Biological age tries to measure something deeper: how much wear and tear your body has actually accumulated.
But the truth is, there's no single "biological age." Different tests measure different things, with different algorithms, trained on different populations. The number you get depends entirely on which test you take.
Epigenetic clocks are the most well-known category. These measure chemical tags on your DNA called methyl groups, which shift in predictable patterns as you age. Scientists trained algorithms on thousands of people to estimate "how old your DNA looks."
Organ-specific panels take a different approach entirely. TruDiagnostic's SYMPHONY breaks your aging into 11 organ systems. Generation Lab's SystemAge does something similar, giving you separate ages for respiratory, immune, metabolic, brain, and other systems. This is where the clinical value starts to get real.
GlycanAge skips DNA entirely. It measures the sugar structures (glycans) attached to your immunoglobulin G antibodies. This is really an immune and inflammatory aging marker, not a whole-body biological age. But given how central inflammation is to aging, it captures something the others miss.
Blood chemistry clocks like PhenoAge and the newer LifeClock use routine lab work you can get from any Quest or Labcorp draw. No fancy methylation arrays, no saliva kits. Just your CBC and metabolic panel.
The point: when someone says they "tested their biological age," you have to ask which kind. A GlycanAge result and a DunedinPACE score and a SystemAge respiratory reading are measuring completely different dimensions of your biology.
Three generations of clocks
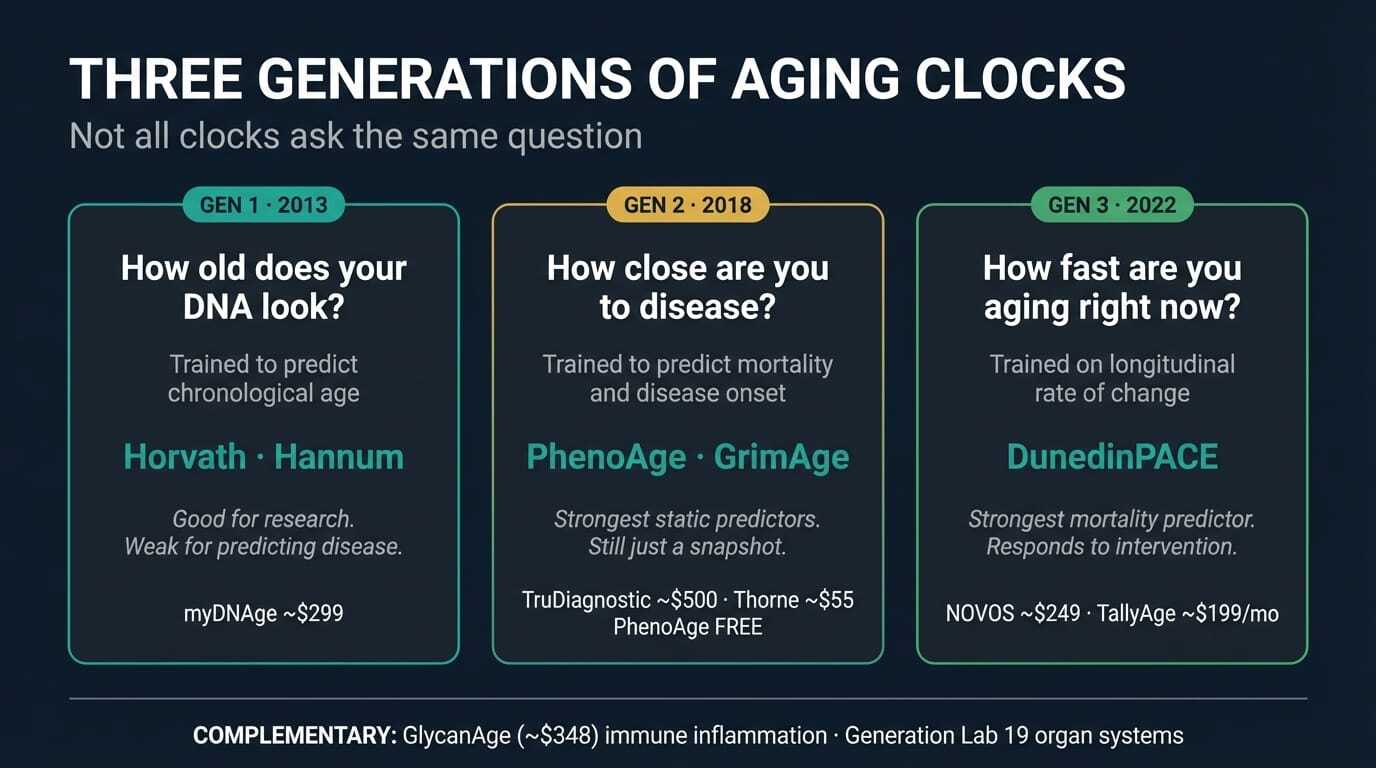
Not all clocks ask the same question. And the question matters more than the answer.
First-generation clocks answered: "How old does your DNA look?" Steve Horvath's 2013 clock and Hannum's companion clock were trained to predict chronological age from methylation patterns across 353 and 71 CpG sites, respectively. They're forensically precise. If you need to estimate a crime scene sample's age, Horvath is your tool. But for predicting disease or death? These clocks have roughly half the effect size of newer ones. In a head-to-head of 14 clocks across 174 diseases in 18,859 people, first-gen clocks consistently underperformed (Mavrommatis et al., Nature Communications 2025).
A clock trained to predict how old you are will be good at predicting how old you are. It won't necessarily tell you how sick you're getting.
Second-generation clocks changed the question to: "How fast are you approaching disease and death?" Morgan Levine's PhenoAge (2018) incorporated nine clinical biomarkers including CRP, albumin, creatinine, and glucose. Ake Lu and Steve Horvath's GrimAge (2019) used DNA methylation proxies for seven plasma proteins plus smoking pack-years. These clocks predict mortality and disease onset, not calendar age. GrimAge consistently shows the strongest associations with cardiovascular disease and cancer across large validation studies.
Big improvement. But both PhenoAge and GrimAge still produce a static number: your estimated biological age at one moment. A snapshot.
Third-generation measures flipped the concept entirely. DunedinPACE doesn't ask "how old is your body?" It asks "how fast is your body aging right now?" A speedometer instead of an odometer. You could be biologically young but accelerating fast. That's the scarier scenario.
The speedometer vs. the odometer
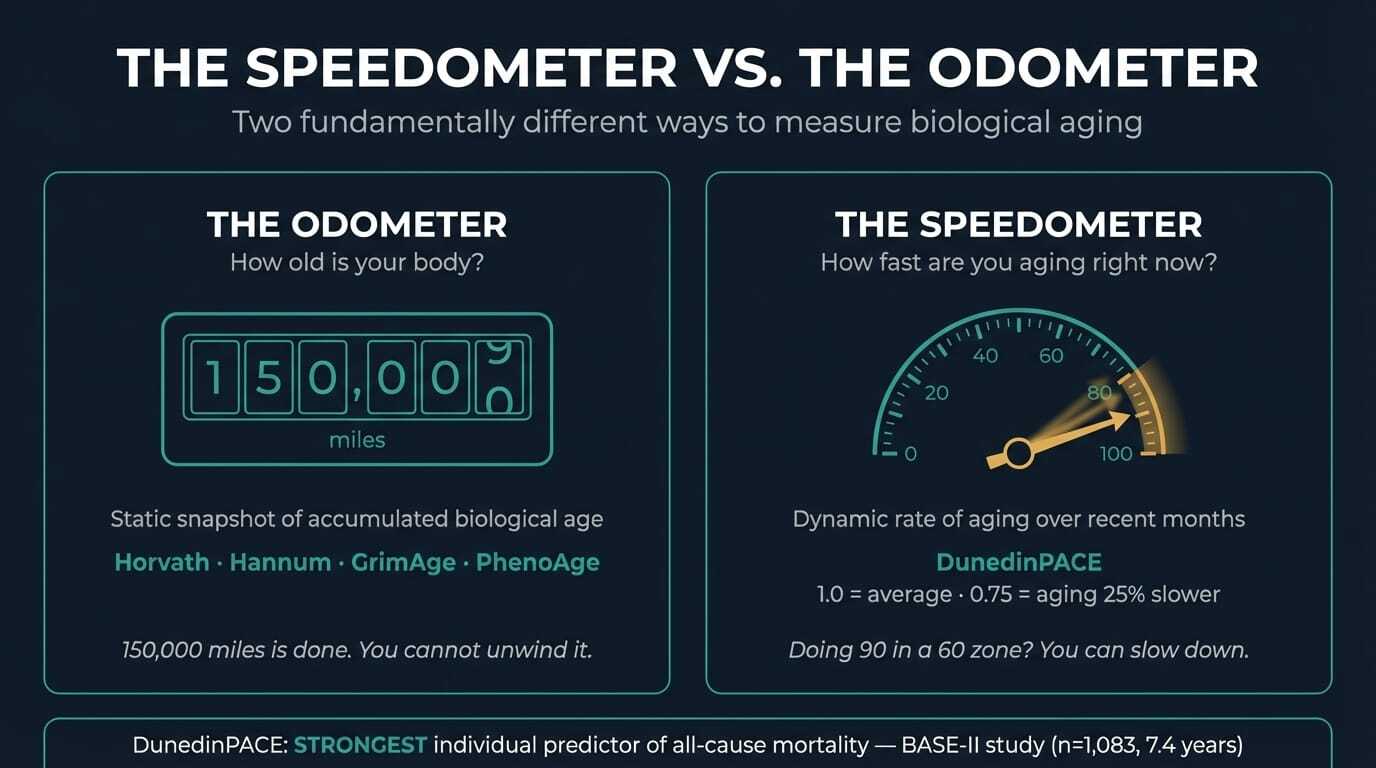
Developed by Daniel Belsky and colleagues at Columbia (eLife 2022), DunedinPACE was trained on longitudinal data from the Dunedin Study: 1,037 people born the same year in New Zealand, tracked across 19 organ-system biomarkers over two decades. The output is a pace score. A score of 1.0 means you're aging at the expected rate. 1.2 means 20% faster. 0.8 means 20% slower.
If your car's odometer reads 150,000 miles, that's done. You can't unwind it. But if your speedometer shows you're doing 90 in a 60 zone, you can take your foot off the gas. DunedinPACE is a speedometer.
A study published earlier this month validated this in the strongest terms yet. Vetter et al. followed 1,083 older adults in the Berlin Aging Study II (BASE-II) for 7.4 years, comparing 14 expert-consented aging biomarkers including IGF-1, GDF-15, CRP, IL-6, muscle mass, grip strength, gait speed, balance, cognition, and multiple epigenetic clocks (Biomarker Research 2026).
DunedinPACE was the strongest individual predictor of all-cause mortality.
Not telomere length. Not grip strength alone. Not the 14 biomarkers combined. A single blood-based DNA methylation test outperformed the full panel. And when combined with just two physical assessments (muscle mass and standing balance), this three-biomarker set captured nearly the same predictive power as all 14 markers together (C-index 0.63 vs. 0.65).
One blood draw. Two minutes of bedside assessment. That's a clinically practical biological age evaluation.
OMICmAge and the multi-modal future
A new clock published in Nature Aging takes a fundamentally different approach. OMICmAge, developed by Chen, Dwaraka, and colleagues at TruDiagnostic and Harvard (Nature Aging 2026), integrates five data layers simultaneously: DNA methylation, proteomics, metabolomics, clinical lab values, and electronic health records.
It outperformed every existing single-omics clock for predicting mortality and disease onset.
Horvath uses methylation. SomaScan uses proteins. PhenoAge uses clinical labs. Each captures one dimension. OMICmAge captures all of them at once.
The clinical significance is real but the practical gap is wide. Running OMICmAge requires multi-omics panels that most clinicians don't have access to. The infrastructure for integrating EHR data with proteomics and metabolomics at scale doesn't exist outside research settings.
What OMICmAge proves conceptually: a single biological age number is insufficient. Your liver's epigenomic age is not your brain's is not your heart's.
A landmark Science paper this month mapped the first atlas of organ-specific chromatin accessibility across the mouse lifespan. Twenty-one tissues, three age groups, both sexes. The finding: about 25% of organ-specific cell types show significant age-related population shifts. Kidney and liver showed faster epigenomic aging. Brain showed partial protection. Forty percent of aging dynamics were sex-dependent.
Different organs. Different clocks. Different interventions needed.
But does any of this really matter?
Okay, this is where you should really pay attention.
A 2024 study from the CARDIA cohort (n=913) compared five measures of biological aging against traditional cardiovascular risk factors. The result? Traditional risk factors (blood pressure, cholesterol, metabolic markers) were comparable predictors of subclinical cardiovascular disease.
The boring bloodwork your doctor already orders predicted heart outcomes better than the $500 epigenetic test.
A 2025 UK Biobank analysis confirmed that Phenotypic Age acceleration does track with cardiovascular events. But so do cholesterol and blood pressure. The question isn't whether biological age testing captures something real. It's whether it captures enough beyond what you already have.
A February preprint strengthened this case further, comparing epigenetic clocks against traditional risk factors (BMI, blood pressure, lipids) for predicting non-communicable disease in middle-aged adults (bioRxiv 2026). Traditional risk factors won again.
But dismissing these tests entirely misses the trajectory of the science. Epigenetic age acceleration strongly predicts incident mild cognitive impairment and dementia in postmenopausal women (2026 data from multiple clock types). DunedinPACE competing with established physical function measures in BASE-II is exactly the large-scale validation that builds clinical utility over time.
So are these tests worth your money? The honest answer requires understanding what each test is actually measuring, and what it can't see.
What's actually new (2025-2026)
The field is moving fast. A few things worth knowing:
Longitudinal tracking beats snapshots. Two papers in Nature Aging in March 2026 (InCHIANTI cohort, up to 24 years) showed that the rate of change in your epigenetic clocks over time is a better predictor of mortality than any single test. If your clocks are accelerating, that's the real danger signal, even if your current result looks fine.
The CALERIE trial proved the speedometer responds to intervention. The strongest evidence that DunedinPACE captures real biological change comes from CALERIE, the only completed long-term caloric restriction RCT in healthy humans. Participants who maintained 25% caloric restriction for two years showed significant slowing of DunedinPACE. Other epigenetic clocks did not budge (Belsky et al., Nature Aging 2023).
Fitzgerald's reversal study. A smaller trial tested an 8-week protocol combining a modified Mediterranean diet, sleep optimization, exercise, stress management, probiotics, and phytonutrients. The intervention group showed a 3.23-year reduction in Horvath biological age compared to controls (PMID: 33844651). Small sample (n=43), but the first RCT to demonstrate potential reversal.
Multivitamins actually moved the needle. The COSMOS RCT (n=958, Nature Medicine, 2026) found daily multivitamin slowed all five epigenetic aging clocks over 2 years, ~4 months of decelerated aging. People who were biologically older at baseline benefited most. However, before you go out and buy Centrum Silver, this effect is basically due to correcting deficiencies…
Aging anxiety speeds up your clock. A February 2026 study found women with higher anxiety about growing older showed faster biological aging on DunedinPACE and GrimAge2. Your psychological state literally writes itself into your epigenome. Or is it because your body senses faster aging and becomes more anxious?
New clock types beyond DNA methylation. In 2025, researchers built epigenetic clocks based on histone modifications rather than DNA methylation, a new class of aging biomarker. And EpiAge, published in Nature Aging, is a pan-tissue clock that works across 19 tissue types.
A unified benchmarking framework. Ying et al. in Nature Aging (2025) published the first systematic framework for evaluating and comparing aging biomarkers.
Important caveat on precision: Technical noise in epigenetic clocks can produce up to 9-year deviations between replicates of the same blood sample (Higgins-Chen et al., 2022). Batch effects across different array platforms remain a real problem. This is why single measurements are unreliable. Trends over time, same lab, same platform, are what matter.
THE CEO'S PROTOCOL: How to use biological age tests
My Results
I've tested my biological age on five different platforms. Here's what came back.
Test | What It Measures | My Bio Age | My Chrono Age (at time of testing) | Difference |
|---|---|---|---|---|
TruDiagnostic OMICm | DNA methylation + proteomics + metabolomics | 33.2 | 36.3 | -3.1 years |
TruDiagnostic SYMPHONY | 11 organ systems via 133 biomarkers | 28.0 | 36.3 | -8.3 years |
DunedinPACE | Speed of aging (rate, not static age) | 0.75x | n/a | Aging 25% slower |
GlycanAge | Immune inflammation via IgG glycosylation | 31 | 36 | -5 years |
Generation Lab SystemAge | 460+ CpG sites across 19 organ systems | 37.8 | 35 | +2.8 years |
PhenoAge (calculated) | 9 clinical blood biomarkers | 20.4 | 35.5 | -15.1 years |
Five out of six say I'm younger. One says I'm older.
The number itself is not the takeaway. What surprised me was what I learned from the disagreements between tests.
Five tests, five different answers. Here's why.

These tests don't disagree because some are right and others wrong. They disagree because they're measuring fundamentally different things.
PhenoAge uses 9 standard blood biomarkers and was trained on NHANES, the general US population. A healthy, optimized person will always score well against a population baseline that includes widespread metabolic dysfunction.
Epigenetic clocks (OMICm, SYMPHONY, Generation Lab) measure DNA methylation patterns at different CpG sites, with different algorithms, trained on different cohorts. SYMPHONY maps 133 clinical biomarkers via methylation; Generation Lab uses 460+ CpG sites across 19 organ systems. Same patient, different data layers, different numbers.
GlycanAge skips DNA entirely and measures sugar structures on your antibodies. It captures immune-mediated inflammation on a timescale of weeks to months, while methylation clocks reflect years of accumulated change. They're not competing. They're complementary.
DunedinPACE measures speed, not position. It was developed from the Dunedin birth cohort, following the same people from birth through midlife. Mine reads 0.75, meaning each calendar year costs me about 9 months of biological time. That's the most actionable metric I have.
Three things a bio-age test can actually tell you (and one thing it can't)
After running all of these on myself, I think a bio-age test has three legitimate uses:
1. Cross-platform pattern recognition. When two independent platforms flag the same system, pay attention. Both Generation Lab and TruDiagnostic flagged respiratory and immune aging independently, using different algorithms. Generation Lab put my respiratory age at 40.2 (five years older than my calendar age). TruDiagnostic showed my lung capacity at the 47th percentile. I have borderline asthma and had COVID several times (with accompanying post-COVID). That explained the respiratory signal instantly. But I wouldn't have investigated further if only one platform had flagged it. The convergence is what made it clinically actionable.
2. Rate-of-change tracking. DunedinPACE and serial GlycanAge are the most useful for tracking interventions. My GlycanAge improved from 32 to 31 over five months, with my anti-inflammatory Glycan Shield going from 83rd to 96th percentile. I believe this primarily showed the resolution of my post-COVID inflammatory changes, as I did nothing else significant during that period to explain the change.
3. Motivation with guardrails. Concrete numbers change behavior more than general advice. But set expectations before you test. Ask: "What clinical decision would this result change?"
What it can't tell you: Your actual risk of a specific disease. A low bio-age does not mean you don't have a ticking lipid problem, a brewing autoimmune condition, or an undiagnosed cancer.
Before spending money on a $300+ test, get the labs your doctor can order today: fasting metabolic panel, CBC with differential, hs-CRP, lipid panel with particle size, HbA1c, fasting insulin. If those are all optimized and you want the next level of data, bio-age testing starts to make sense.
Tier 1: The $200 labs that match a $500 epigenetic test
These are the traditional markers that held their own against bio-age scores in the CARDIA study.
Fasting metabolic panel + CBC with differential. Your albumin, creatinine, glucose, lymphocyte percentage, MCV, RDW, ALP, and WBC count are literally the nine inputs for PhenoAge. You can calculate your PhenoAge for free from standard blood work.
hs-CRP. The single best inflammatory biomarker for cardiovascular risk stratification. Mine: 0.5 mg/L. Optimal vs. normal: Below 0.5 = excellent. 0.5-1.0 = low risk. 1.0-3.0 = moderate. Most lab "normal" ranges go up to 10.0, which is absurd from a prevention standpoint.
Fasting insulin + HbA1c. Insulin resistance is the metabolic accelerant behind most chronic disease. My insulin: 3.1 µIU/mL. HbA1c: 5.3%. Optimal vs. normal: Most labs call fasting insulin under 25 "normal." That bar is on the floor. Under 5.0 is excellent, under 3.0 is elite. Above 7-8 and you're pre-diabetic by function even if your glucose looks fine.
Advanced lipid panel (with particle size). Standard LDL is a screening tool, not a precision metric. Before treatment, my LDL-C was 192, ApoB was 128, and LDL particle number was 2,291 nmol/L. After intervention (Repatha + ezetimibe), my most recent numbers: LDL-C 37, ApoB 45, LDL-P 911. The trajectory matters more than any single draw. Optimal: LDL-C under 70, LDL-P under 1,000, ApoB under 80.
How to interpret the full picture: If your CRP is under 1.0, fasting insulin under 5.0, HbA1c under 5.5, ApoB under 80, and LDL-P under 1000, your metabolic foundation is solid. Bio-age testing adds nuance on top.
Tier 2: The speedometer (~$300-500)
DunedinPACE is the metric I track most diligently. It measures how fast you're aging right now, over the last 2-3 months. Context: 1.0 = population average. Below 0.85 = you're aging slower. Below 0.75 = top tier. Very few intervention studies have pushed people this low.
What moves DunedinPACE: Zone 2 cardio (4x/week, minimum 30 min), strength training (3x/week), time-restricted eating (16:8 most days), consistent 7-8 hour sleep, stress management. Cortisol spikes from chronic stress are probably the most underrated accelerant.
GlycanAge is my favorite for tracking inflammatory trajectory. It responds over weeks to months, faster than methylation clocks.
I look at the organ-specific breakdowns for outliers. If everything looks good except liver epigenetic age is accelerated, that narrows my investigation. Is it alcohol? NAFLD? Environmental toxin exposure? The specificity guides the workup.
Tier 3: Where two tests agree (~$500+, 1-2x/year)
TruDiagnostic SYMPHONY breaks aging into 11 organ systems. Every system was aging slowly except immune and hormone, which lagged. I suspect COVID did a number on my immune metrics. I'll recheck to see if the pattern is persistent.
Generation Lab flagged my respiratory system aging fastest (40.2 vs calendar age 35). Not surprising given the COVID and asthma. I've started breath training and will track whether respiratory age shifts.
I've also seen patients with great DunedinPACE scores and elevated glycan age. That tells me their immune system is running hot even though their overall methylation looks good. Different signal, different intervention. Usually it's chronic low-grade inflammation from gut permeability, sleep disruption, or unaddressed autoimmunity.
The Best Three-Biomarker Assessment Money Can Buy
The Vetter BASE-II data gives us an easy shortcut to a highly validated set of tests: DunedinPACE + muscle mass + standing balance captures nearly as much predictive information as a full 14-biomarker panel.
Specifically:
DunedinPACE (blood draw, ~$250-500 depending on platform)
Scale centered at 1.0 = aging one biological year per calendar year
Below 0.90 = top quartile (goal). 0.90-1.10 = monitor. Above 1.10 = intervene. Population range roughly 0.6 to 1.4.
DEXA-derived appendicular lean mass index (easy to get if you’re already running a DEXA for body composition)
Formula: (lean mass of arms + legs) / height²
Sarcopenia cutoffs (clinical concern): women < 5.5 kg/m², men < 7.0 kg/m²
Optimization targets: women ≥ 6.5-7.0 kg/m², men ≥ 8.0-8.5 kg/m² (75th+ percentile for healthy young adults)
Timed single-leg stance (eyes open, 30-second target for over-65 yo; eyes closed for under-50 yo)
Under 10 seconds eyes open at any age = strong fall predictor
Over 65 (eyes open): target ≥ 20 seconds
Under 50 (eyes closed): target ≥ 20 seconds
Normal 20-39 year olds hit 28-30 seconds eyes open; by 70s, mean drops to ~8.5 seconds
Takes 10 minutes and delivers a C-index of 0.63 vs. 0.65 for the full panel.
If You Want to Test on Your Own
Not everyone has a longevity physician. Here's what I'd recommend if you're ordering directly:
Best comprehensive option: TruDiagnostic TruAge COMPLETE (~$500+). Most data. Reports DunedinPACE, multiple clocks, telomere length, and organ-specific metrics. Dense 78-page report. Best if you want everything and have someone to help interpret it.
Best value for tracking: NOVOS Age (~$249). Focuses on DunedinPACE specifically. Leaner report, designed for repeat testing and intervention tracking. Best if pace of aging is your primary question and you plan to retest.
Worth watching: Elysium Index ($299-499). Proprietary model. Less transparency on methodology but streamlined user experience.
Non-invasive entry point: TallyAge (~$199/month membership, Tally Health). Cheek swab only, no needle required. Good for those who want to start tracking without a blood draw (although least validated).
Lowest-cost start: Thorne Biological Age (~$55). Clinical biomarker-based, PhenoAge-style scoring. If you want a structured score from a blood draw and don't want to spend $300+, this is the entry point.
Gen 1 reference benchmark: myDNAge (~$299). Horvath clock-based, blood or urine sample. Worth it if you want a direct chronological age estimate for comparison, but not the most actionable for intervention tracking.
Different signal: GlycanAge (~$348). Measures IgG glycosylation for inflammatory/immune aging. Not a replacement for epigenetic clocks, but a useful complement.
Free option: PhenoAge calculator. All you need is a recent CBC and CMP from any lab. Free online calculators will compute your score. Strong baseline, zero cost, zero additional blood draws if you already have recent labs.
My protocol for self-testers: Get your baseline. Make your changes (the basics: sleep, Zone 2 cardio, manage metabolic health, clean up your diet). Retest at 6 months, same company, same platform. If your pace drops, your interventions are working at the molecular level. If it doesn't, adjust and retest at 12 months. That's the whole point: a feedback loop, not a verdict.
How I Counsel Patients
When a patient's DunedinPACE comes back elevated (say, 1.12 or above), I don't panic them. I walk through what the number means: you're aging about 12% faster than the population average. This is not a death sentence. This is a signal that something in your biology needs attention.
Then we look at the basics. Sleep quality (not just quantity, but architecture). Exercise consistency. Metabolic panel trends. Inflammatory markers. Stress load. Alcohol intake. In about 70% of cases, we find something obvious that the patient either knows about or suspected. The clock just confirmed it with molecular data.
For the other 30%, where the basics are dialed in and the pace is still elevated, that's when I expand the investigation. PFAS panel. Heavy metal assessment. The clock told us something is wrong. Now we have to figure out what.
When DunedinPACE comes back favorable (below 1.0), I celebrate with them. But I also remind them: the things that got them here are the things keeping them here. I've had patients see a great result and decide they could ease up on exercise or let their sleep slide. Six months later, the pace ticked up. Biology doesn't give you credit for past performance. It measures current trajectory.
The most powerful moment is the retest. When a patient who had a DunedinPACE of 1.15 comes back at 0.95 after six months of consistent changes, that's transformative. Not because the number changed. Because they have proof that their choices altered their biology at the molecular level. That's when it clicks for people.
What I tell patients before they test: Test if you're going to act on it. An aging score without a plan is just expensive anxiety. Before ordering any epigenetic test, I make sure a patient has completed a standard metabolic workup: fasting lipid panel, HbA1c (or better, fasting insulin + HOMA-IR), comprehensive metabolic panel, high-sensitivity CRP, homocysteine, and vitamin D. If their basic metabolic health isn't optimized, the epigenetic clock will reflect that. No point measuring the speedometer when your engine light is already on.
I also set expectations about precision. I tell every patient: "This number will have noise. We're not looking for your age to the decimal. We're looking for your trend over 6 to 12 months. One number means almost nothing. Two or three data points start telling a story."
The Honest Cost
I spend roughly $1,500/year on bio-age testing beyond standard labs. That's not trivial, but it’s part of my job. For most people, the Tier 1 bloodwork gives you 80% of the clinical value for 20% of the cost. The bio-age adds nuance: organ-level data, pace of aging, inflammatory trajectory. But it's a luxury layer, not a foundation.
The test is only as good as what you do with the result.
My Retesting Schedule
Test | How Often | Why |
|---|---|---|
PhenoAge (from labs) | Every time I get blood work | Free, takes 2 minutes to calculate |
TruDiagnostic (epigenetic) | Every 6 months | Captures cumulative epigenetic changes + pace of aging |
GlycanAge | Every 3-6 months | Fastest responder to lifestyle changes |
Generation Lab | Annually | Cross-reference for organ systems |
Links & Codes
I have clinic partnerships with several of these companies, which means I can offer special pricing to my readers and patients.
My Longevity Practice - I offer biological age testing panels, interpretation, and personalized longevity protocols. If you want physician-guided testing rather than DIY, start here.
TruDiagnostic - I have provider pricing available through my clinic as well.
GlycanAge - Measures your immune system's biological age through IgG glycosylation. Code CARECORE for a discount.
Generation Lab - Organ-level biological age across 19 systems from a single blood spot (provider pricing here).
PhenoAge - Free to calculate. All you need is a recent CBC and CMP. Several online calculators exist, or your longevity clinician can run it from existing labs.
And you can book a consult with me to go over any of the above if helpful.
🆕 Something New
KEY TAKEAWAYS
📌 Traditional bloodwork predicts cardiovascular outcomes as well as most single-modality bio-age scores. Get those labs first. If you haven't optimized your lipid panel, HbA1c, blood pressure, and CRP, an epigenetic clock won't tell you anything they don't already reveal.
📌 DunedinPACE is the most clinically validated aging clock. It measures how fast you're aging, not how old you look. The BASE-II study confirms it outperforms 13 other biomarkers for mortality prediction.
📌 Different tests measure fundamentally different things. They WILL give you different numbers. That's not a bug, it's biology.
📌 First-generation clocks (Horvath, Hannum) are research tools, not clinical tools. They predict chronological age, not disease or death. Don't spend money on these for personal health tracking.
📌 Highest-value use: cross-platform pattern recognition + rate-of-change tracking. When two independent platforms flag the same system, pay attention. DunedinPACE and serial GlycanAge are the best tools for tracking whether your interventions are working.
📌 Test for trends, not snapshots. One measurement is noise. Repeat at 6-12 months on the same platform. The trend is the signal. Longitudinal tracking beats everything.
📌 Before buying a test, ask: "What clinical decision would this change?" If you can't answer that, you're not ready for the test.
LONGEVITY QUICK HITS
🧠 Your gut bacteria are hijacking your aging brain. Penn/Stanford researchers identified a specific bacterium (Parabacteroides goldsteinii) that triggers a GPR84 → vagal nerve → hippocampus pathway driving age-related memory loss. Blocking it restored memory in aged mice. This isn't vague "gut health" advice anymore. It's a named target (Nature).
🍊 Vitamin C might actually reverse biological aging. Here's the mechanism. A 40-month primate study found vitamin C directly inhibits ACSL4, blocking a newly identified "ferro-aging" pathway of iron-driven tissue damage. Epigenetic clocks showed reversal, not just slowing. Steve Horvath and Altos Labs are co-authors (Cell Metabolism).
⚠️ Before you try senolytics, read this. The popular dasatinib + quercetin combo caused profound myelin loss in mice by pushing oligodendrocytes into a dysfunctional state. Damage was actually worse in younger animals. Preclinical, but a real caution signal for anyone taking D+Q prophylactically (PNAS).
🍄 Psilocybin beats nicotine patch for smoking cessation. First head-to-head RCT: 40.5% quit rate vs. ~10% for the patch. The psychedelic-as-medicine evidence keeps building.
💊 GLP-1 muscle loss: the definitive paper is here. Four preclinical studies plus a clinical trial show GLP-1 drugs predominantly reduce fat, not functional muscle. Absolute lean mass dips slightly, but relative strength and running performance both improve. The muscle loss narrative was always incomplete (Cell Reports Medicine).
💉 BELIEVE trial: bimagrumab + semaglutide achieved 22% weight loss with 93% from fat. The muscle-sparing GLP-1 combo everyone's been waiting for.
🏆 Wegovy just got a lot stronger. FDA approved Wegovy HD at 7.2mg, the highest-dose semaglutide injection ever. STEP UP trial showed ~21% weight loss.
👁️ Wegovy dose-dependent eye stroke risk. On that note, 5x higher NAION (non-arteritic anterior ischemic optic neuropathy) vs Ozempic, mainly due to the higher dose.
💉 One gene edit. Permanently lower LDL. In vivo base editing of PCSK9 via lipid nanoparticle showed safety and dose-dependent LDL-C reductions in patients with familial hypercholesterolemia. If this scales, it could replace lifelong statin or PCSK9 inhibitor regimens with a single treatment (Nature Medicine).
🔥 Your body already makes an anti-aging molecule. It's called PEP. Phosphoenolpyruvate, a glycolytic intermediate, acts as an endogenous brake on the cGAS-STING inflammatory pathway during aging. This reframes inflammaging as a battle your body is actively fighting, not just losing (Nature Aging).
💊 GLP-1 drugs reduce addiction risk across every substance class. In 603,404 U.S. veterans, GLP-1 receptor agonists were associated with lower risk of substance use disorders for alcohol, opioids, cannabis, stimulants, and tobacco (BMJ).
😴 Your afternoon nap might be aging you faster. A Mendelian randomization study found daytime napping independently accelerates GrimAge and frailty. Longer nighttime sleep, by contrast, protects against frailty. The distinction matters (Clinical Epigenetics).
FROM THE LONGEVITY SHOW
In this early video from my podcast, I break apart the real science of biological aging and how to reverse it scientifically.
Keep learning,
Hillary Lin, MD
Was this useful? Forward it to someone who's been thinking about testing their biological age.
Want to turn your wellness brand into a full-service health destination? Learn about CareCore's platform or Get Started Here
Where to find me:
👱🏻♀️👩🏻🦰👩🏻👧🏽👧🏾 Livelong Women’s Health Summit — April 17-18, 2026, SF, CA. Delighted to join 50 other thought leaders in speaking on women’s longevity! (Code HILLARY50 for $50 off)
Support us with your longevity purchases:
NeuroAgeTx — the most comprehensive brain aging package at up to 61% off for Longevity Letter readers
Timeline — patented Urolithin A for scientifically proven mitochondrial support via mitophagy (Code CARECORE for 10% off)
GlycanAge — measures your immune system’s biological age and recommends how to fix it
ZBiotics — pro-longevity probiotics for when you do have a little fun (Code CARECORE for 10% off)
The Longevity Letter
A weekly read on tests, treatment, and claims.
New issues look at what the evidence supports, what is premature, and what to skip.